Visualizing Stats
Today I'll tackle Range selectors.
I need to add a simple picker to the dashboard and a filter on the backend.
Done. Next up, I'd like to implement the visualization.
For that, I'll need to make the backend return previous values as well.
After doing that, I realized I didn't think this through very well. Not only do I need previous values (For example, at 7 weeks ago), I also need the data points for each day.
Phew! That took a while, but it's finally done. I can now visualize a date range and compare it to the previous.
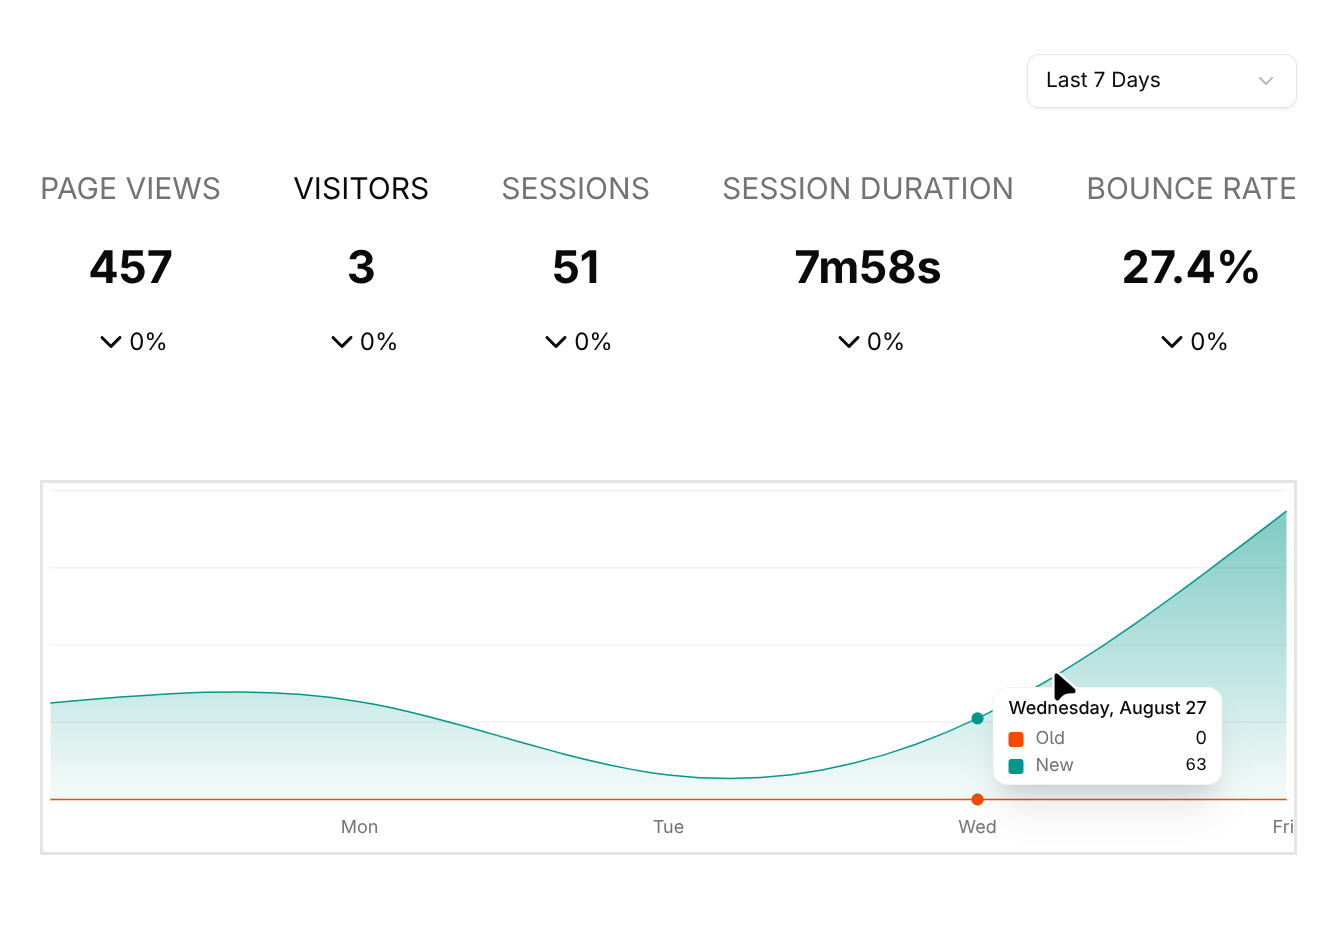
Currently I'm visualizing the page views, but I want to make it selectable. I'll do that next.
Looking good. Not worrying about the styling yet.
Next steps:
- Trend Indicators
- Different stats per metric
- Website Selector
- Visual Touches
Very happy with progress!